Where do the Vols land after a tough week?
A new year is here, and so is the brand new college basketball landscape. Super conferences everywhere has created for some of the more cluttered, unconventional, overly competitive power conference seasons for 2024-25.
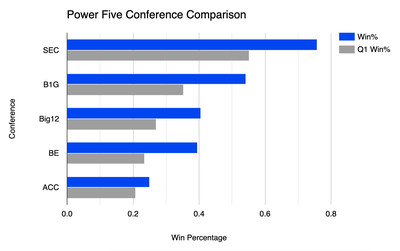
With that comes a far more convoluted version of bracketology that we all now must sift through. That being said, a primary resource we have right now are non-conference games to compare conferences against each other with. To no one’s surprise, the SEC and Big Ten are leading the pack, but it really is just the SEC right now. In fact, this is how the non-conference records against power five conferences look by conference:
- SEC: 56-18 (.757)
- Big Ten: 26-22 (.542)
- Big XII: 17-25 (.405)
- Big East: 15-23 (.395)
- ACC: 17-51 (.250)
This has resulted in a pretty hefty differential. It gets even more drastic when you add in Quad 1 results up to conference play:
- SEC: 37-30 (.552)
- Big Ten: 31-57 (.352)
- Big XII: 17-46 (.270)
- Big East: 11-36 (.234)
- ACC: 15-57 (.208)
Here is how that stacks up:

It really is stark.
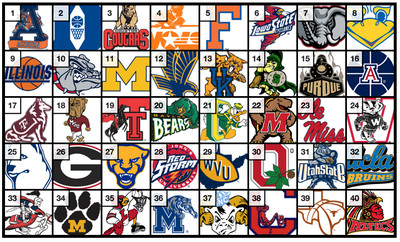
Moving into the seeding, I want to take a look at the top 40 in the NET rankings right now. It is important to remember that the NET is not a power ranking, it is a sorting tool. Take of that what you will.

Of the top 40, 11 reside in the SEC, 9 in the Big Ten, 7 in the Big 12, 5 in the ACC, and 3 in the Big East. Gonzaga and Saint Mary’s represent the WCC along with Memphis (AAC), Utah State (MWC), and San Diego State (MWC) to round up the only five non-power conference teams in the top 40.
Now, before we get into the reveal of the field, I want to go over some terms that I will use frequently throughout this process. The transparency in doing this will hopefully clear up any confusion that may come along.
NET: the NET rankings, short for NCAA Evaluation Tool, are, as you’ve seen above, the predominant sorting tool of teams vying for at-large spots in the NCAA Tournament. It is important to note that it is a sorting tool, not a power ranking. It is merely a data piece amongst a swath of data pieces used to create the seeding. Metrics that go into the NET are things like game outcome, location (home/away/neutral), margin of victory, strength of opponent, and offensive and defensive efficiency.
Wins Above Bubble: Usually abbreviated as WAB, wins above bubble is a metric that takes a team’s wins and compares them to the number wins the average bubble team would have against their same schedule. It is a great comparison tool and another piece of the puzzle.
‘Quadrant’ wins: Quad wins are based who you beat and where you beat them. Using the NET rankings, results are split into four quadrants with a subset added to Quadrant 1 games for extra high caliber games (top half of Q1), labeled Quad 1A games. Quad 1A is not officially recognized, but it is a sortable category on Bart Torvik’s site and is additionally useful.
Quad 1A: Home vs. NET top 15, Neutral vs. NET top 25, Away vs. NET top 40
Quad 1: Home vs. NET top 30, Neutral vs. NET top 50, Away vs. NET top 75
Quad 2: Home vs. NET 31-75, Neutral vs. NET 51-100, Away vs. NET 76-135
Quad 3: Home vs. NET 76-160, Neutral vs. NET 101-200, Away vs. NET 135-240
Quad 4: Home vs. NET 161-353, Neutral vs. NET 201-353, Away vs. NET 241-353
Strength of Record (SOR): SOR is ESPN’s strength of schedule metric that goes a step beyond. It takes a deeper look at how a team truly performed against its schedule overall and is relative to the quality of opponents played.
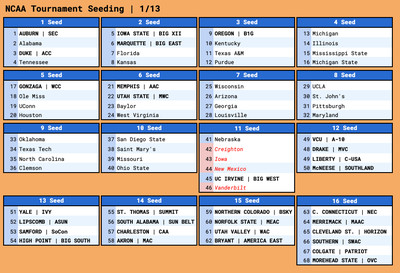
Now, for the field:

Vols cling to one seed
Despite a 30 point loss to Florida, Tennessee still cracks our first seeding as the final one seed after picking up a gritty Quad 1 win at Texas. Tennessee playing that poorly again is impossible to envision, and I think they proved that they’re capable of playing ugly and winning against Texas. The Vols made just 4 of 29 three-point attempts at Florida, and while Florida didn’t play exceptionally on offense, it largely came down to 12 made shots all night for Tennessee. However, the gap between Tennessee and Iowa State is extremely narrow, so much so that both teams could theoretically win their next games against Georgia and Kansas respectively and flip spots depending on how the games are won.
Auburn leads the way for the one seeds
Auburn begins our trek to March as the top overall seed following a late run to get by South Carolina. Bruce Pearl’s Tigers rank number one in pretty much every meaningful metric. They’re tops in the NET, SOR, wins above bubble, offensive rating, and quad 1 wins. Johni Broome has developed into a legitimate National Player of the Year contender, but his injury and its severity loom large right now. Auburn’s offensive rating on KenPom sits at 130.2 freshly into conference play. It ranks 5.2 higher than second highest Alabama’s mark of 124.8. The difference between Auburn and Alabama is greater than the difference between the Tide and Mississippi State’s 20th ranked O-rating. Auburn is 15-1 with their lone loss coming to one of two teams close to them right now for that top seed, the Duke Blue Devils.
Remember how we talked about how good the SEC has become and how the ACC has fallen off a bit? It may be a detriment to Duke and their hopes for the top overall seed. Freshman phenom Cooper Flagg has been sensational for the Blue Devils, and with Broome’s injury, he likely takes front-runner duty for NPOTY. The issue for Duke’s 1-seed and top overall seed outlook is that they have just three Quad 1 opportunities remaining this season as things stand today. Despite Duke playing mostly great in their tough non-conference schedule, picking up five Quad 1 wins, they simply can’t afford to lose any of the three remaining Q1 shots they’ll have. For comparison, eight of Tennessee’s next nine games are against Quad 1 opponents, and Auburn’s next five games are Quad 1 matchups as things stand today. Alabama’s entire month of February is all Quad 1 games. The margin for error for these SEC teams is so much greater than Duke’s simply off the strength of the conference. Who’d have ever thought we would see a day where the ACC is struggling with conference strength?
Houston, we have a (Q1) problem
On the opposite spectrum of the Quad 1 game is a team like Houston. The Cougars currently sit at a seven seed. Obviously, this won’t be where they sit a month from now, but that’s the interesting part of this discussion so early on into the Bracketology side of things and the difference between metrics and résumé. Houston is 11-3. They rank 4th in the NET, 4th on KenPom, currently boast a top 20 offensive efficiency rating and are 2nd behind Duke defensively.
However, Houston’s three losses were the only Q1 games they’ve played thus far. While Houston currently sits at four in the NET, they’re the only team in the NET top 15 not only without a Quad 1 win, but without multiple Q1 wins. Houston ranks 30th in wins above bubble at +1.6, and 30th in SOR and have just two wins over teams in the top two Quadrants. Of teams in the top 30 in the NET, just Texas Tech, Maryland, Georgia, and Ohio State have just 2 Q1-2 wins, and each of them have at least one win over a Q1 opponent.
That’s all to say that I anticipate that this rectifies itself over time. Houston is a very good basketball team. Houston has blown out just about everybody in their 12 wins, namely in Big 12 play thus far. The Cougars are 4-0 early in conference play with wins of 13, 31, 19, and 30. As the season rolls on, and the Quad 1 chances increase for the Cougs, expect them to continue to move up, but right now, there’s a firm cap on them at the five line until that top of the line résumé improves.
The Bubble

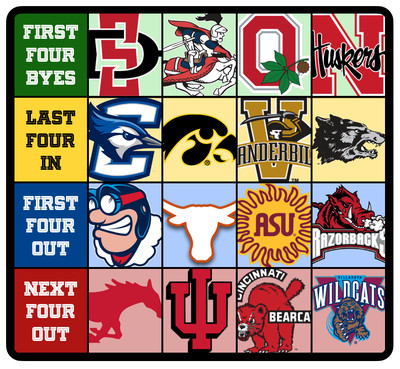
The bubble, as it stands, is expectedly very fluid. As results in conference play continue to build up, teams will make or break their own cases. Right now, there’s two very simple groups to break these teams into.
Power Conference Margin for Error
In this group resides the power conference teams that make up any of these slots. Ohio State, Nebraska, Creighton, Vanderbilt, Texas, Arizona State, Arkansas, SMU, Indiana, Cincinnati, and Villanova all fall in this near catch-all category. Essentially, this covers teams with at least six chances remaining at picking up Quad 1 wins. This essentially means they have less room to fall compared to the exponential growth they could see if they found success in some of those games.
Non-Power Conference Margin for Error
This essentially is for the teams of the Mountain West, A-10, and WCC you see here, and I’ll even lump SMU in this group as they have just two Q1 opportunities remaining as it stands. The opportunities for big time Q1 wins are few and far between for this group. San Diego State has just two remaining Q1 matchups, as does Dayton. The overall strength of the WCC is going to give Saint Mary’s a little leeway as they have 5 Q1 games remaining, but fringy Quad 1 games against teams in those NET ranking areas that could fall into Q2 qualifications are everywhere for Saint Mary’s. Their wins on a neutral court over Nebraska (44) and at Utah (74) are hanging on by a thread to Q1 status while they’ll need USC to continue to rise and possibly nab one back there.
